In order to be able to perform a decent risk analysis, it is more or less required to have the processes transparent.
Which processes are there, and how is their flow? From an operational risk management point of view one should pay
specific attention to the ‘who’ and ‘with what’. In the end you will know which processes contain risks and how these
can be managed.
The mapping of processes supports risk analysis in the following ways:
• Giving insight in the processes;
• Make an inventory of the risks
• Making clear the measures taken to mitigate the risks;
• Being able to measure risks;
• Being able to monitor risks;
• Being able to manage risks;
• Being able to communicate and report about risk management.
So, when creating process maps, be aware that these should give an answer to questions like: which risks are there?, to
what extent? and which measures are already taken or should be taken? The aspects taken into account with respect to
(operational) risk management are:
• Process flows;
• Risks
• Risk categories
• Impact/consequence if risk occurs
• Probability of risk occurring
• Measures of control / Risk mitigations
• Which part of the risk is covered
The risks and controls are normally visualized within the process flows themselves. The risk details are described in
business control charts. Next to the business control chart predefined excel sheets are regularly used to describe and
maintain the risks that occur in the business process. As mentioned before these risk can be broader than only the
operation and could also address for instance, employees, suppliers, confidentiality, environment etc.
A rather generic approach for the analysis and control of risks in business processes is described here. Be aware that
this approach partly concerns the design of the future state! (part of step 2 and step 3):
Step 1 - Risk inventory
• Determine the risks by walking through the process. The main question is: What can go wrong?
Step 2 - Risk and control analysis
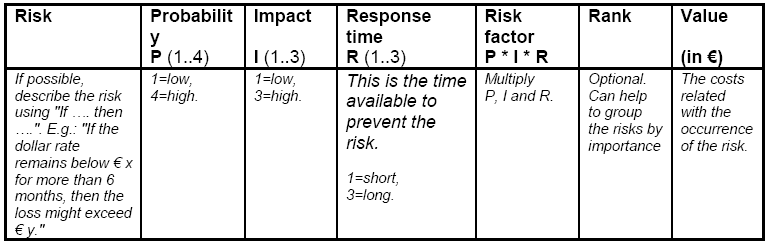
• Fill in the risks in a risk matrix (see example below).
• For each risk, determine the probability of it occurring, the impact and response time (this is the time available to
prevent the risk). Be aware that determining the impact and response time can be subjective.
• Determine the rank of the risks by calculating the risk factor: Risk factor = probability * impact * response
time
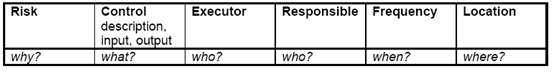
• Determine the controls that are already in place by using the process model and the risk matrix you filled in
previously. Use a control matrix to fill in the details (see example below). This matrix, in combination with the risk
matrix, will also help you define the controls that are missing or that need to be more effective. When defining new
controls, be sure to answer the five 'W questions' mentioned above.
• Complete the process description with the new and changed controls.
Step 3 - Control implementation
• This step depends on the controls you have chosen to implement.
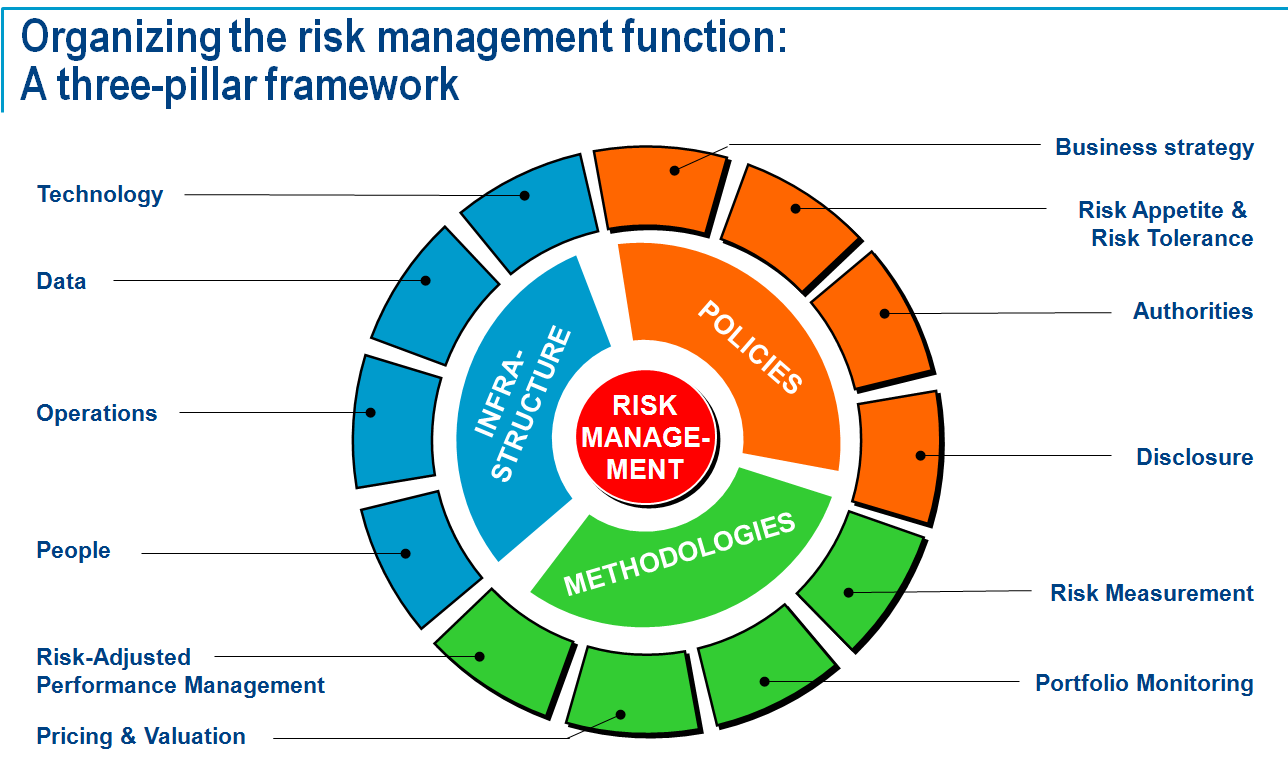
One should be aware that processes (operations) are just one aspect of risk management. For the purpose of BPM
engagements it can help to use the following figure as a help to determine which other aspects are relevant . At least
one should know whether the organization has a written down Risk Policy (and adheres to it).
Input :
• Process flow diagram
Output :
• Process flow diagram –new and changed controls included
|
